
With the season now open us and rosters largely set for the next three months, Opendorse has revealed a chart of how Power 4 programs spend their money on players.
The chart is self-explanatory, and there's a lot to take in. Some things that jump out to me:
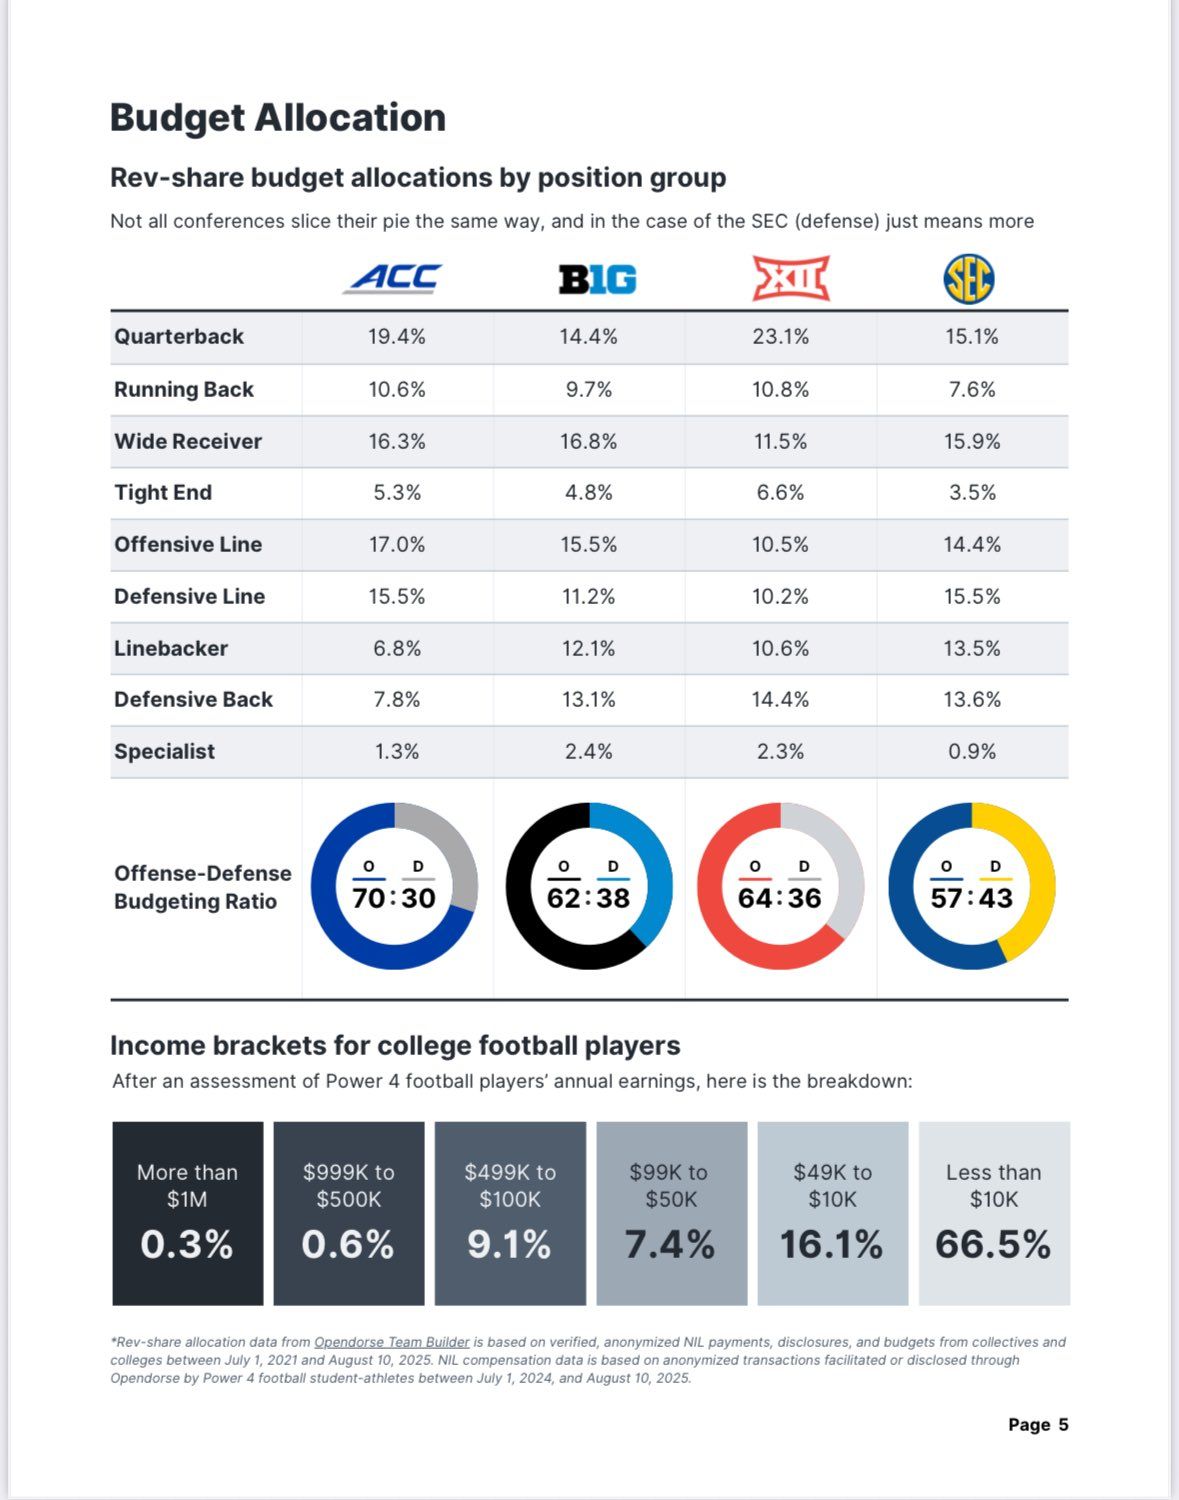
1) I've written this before, but the buzzword of 2021, 2022 and 2023 -- "guardrails" -- is mostly here, we just don't use that word. "Guardrails" exist in the form of "budget allocation." After a few chaotic, miserable years, the industry at large has realized it's much cheaper in the long run to pay up to keep your own guys rather than the alternative. And if the industry generally coalesces around a certain number for a position group, a player generally isn't going to get in the portal just to see what offers come his way. Sure, guys will still move from FCS and the Group of 5 into the Power 4 and there's stratification within the Power 4 (no one thinks Ohio State and Purdue are the same, no offense to Purdue), but the wild, wild west days are mostly behind us.
2) The Big 12 spends more than every other conference on its quarterbacks, which makes sense given the group they have playing in that league.
3) That written, the Big 12 is significantly below the rest of the Power 4 in spending on its lines. The ACC spends nearly one out of every three dollars on its offensive and defensive lines, and the SEC is three in 10. The Big 12? Barely one of five.
4) It wouldn't surprise me if some guys that Opendorse counted as linebackers are edge defenders that are closer to your traditional defensive end than Mike and Sam.
5) The ACC spends the relative most on offense, and the SEC the relative least. It will be interesting to compare apples-to-apples numbers across conferences at the end of the season. How much more higher-scoring is the typical ACC game than the typical SEC game?
6) I would not have guessed that two-thirds of Power 4 football players earn less than $10,000 a year on the NIL market, though we are less than two months into the rev-share era. Let's check back in a year and see how that number compares.
That's what jumped out to me. What jumps out to you?