When we in the media refer to a team being the best in college football at a particular aspect of the game -- pass rush, running game, red zone defense -- we typically limit the scope of that analysis to FBS.
But, as we know, there is far more to college football below the highest level.
FootballScoop has broken out its inner nerd to examine who really had the best running defense on a pound-for-pound basis throughout college football. And the best scoring offense. And the best turnover margin. You get the point. We could have gone really into the weeds here, but instead limited ourselves to 18 major categories. If you're looking to fix your.... well, fill in the blank... this offseason, talking to a staff on this list is probably a good place to start.
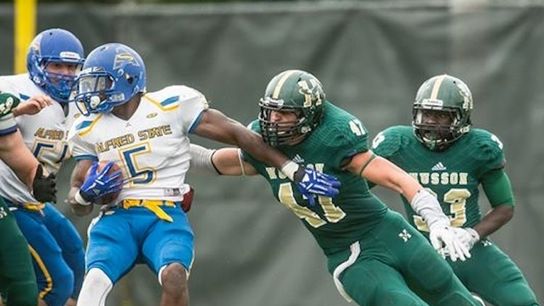
For instance, someone needs to get themselves to Bangor, Maine, and talked to the Husson University staff to figure out how on earth head coach Gabby Price, defensive coordinator Grant Caserta and the Eagles managed to lead the entirety of college football in total defense, yards per play allowed, pass efficiency defense, rushing defense, yards per carry allowed and third down defense.
Scoring Offense
FBS: Western Kentucky -- 44.5 points per game
FCS: Sam Houston State -- 49.5
D2: California (Pa.) -- 49.6
D3: East Texas Baptist -- 49.9
NAIA: Reinhardt (Ga.) -- 51.4
Total Offense
FBS: Texas Tech -- 566.6 yards per game
FCS: Sam Houston State -- 547.3
D2: Colorado Mines -- 566.8
D3: Hendrix (Ark.) -- 600.0
NAIA: Morningside (Iowa) -- 578.4
Yards Per Play
FBS: Western Kentucky -- 7.65
FCS: Sam Houston State -- 7.17
D2: Ashland (Ohio) -- 7.55
D3: Hendrix (Ark.) -- 8.02
NAIA: Marian (Ind.) -- 8.10
Passing Efficiency
FBS: Oklahoma -- 193.78
FCS: James Madison -- 181.69
D2: Indiana (Pa.) -- 183.44
D3: Hendrix (Ark.) -- 182.60
NAIA: Marian (Ind.) -- 187.92
Passing Offense
FBS: Texas Tech -- 463 YPG
FCS: Eastern Washington -- 401
D-II: Seton Hill -- 373
D-III: Franklin -- 402
NAIA: Campbellsville -- 385
Rushing Offense
FBS: New Mexico -- 350.0 yards per game
FCS: The Citadel -- 348.2
D2: Harding (Ark.) -- 362.8
D3: Washington & Lee (Va.) -- 390.3
NAIA: Reinhardt (Ga.) -- 360.0
Yards Per Carry
FBS: New Mexico -- 6.61
FCS: Charleston Southern -- 6.02
D2: Sioux Falls (S.D.) -- 6.88
D3: Salisbury (Md.) -- 6.91
NAIA: Reinhardt (Ga.) -- 6.84
Third Down Offense
FBS: Navy -- 54.5 percent
FCS: Cal Poly -- 53.6
D2: Ashland (Ohio) -- 59.5
D3: Huntingdon (Ala.) -- 55.8
NAIA: Reinhardt (Ga.) -- 60.9
Red Zone Touchdown Percentage
FBS: Navy -- 79.71 percent
FCS: Idaho State -- 84.62
D2: Northwest Missouri State -- 83.33
D3: Concordia Chicago -- 87.10
NAIA: N/A
Scoring Defense
FBS: Alabama -- 13.0 points per game
FCS: Villanova -- 15.0
D2: Northwest Missouri State -- 12.0
D3: Monmouth (Ill.) -- 9.5
NAIA: Marian (Ind.) -- 11.9
Total Defense
FBS: Michigan -- 261.77 yards per game
FCS: Villanova -- 259.8
D2: Northwest Missouri State -- 240.9
D3: Husson (Maine) -- 181.7
NAIA: Marian (Ind.) -- 243.2
Yards Per Play Allowed
FBS: Alabama -- 3.99
FCS: Stony Brook -- 4.18
D2: Northwest Missouri State -- 3.81
D3: Husson (Maine) -- 3.35
NAIA: Marian (Ind.) -- 3.88
Pass Efficiency Defense
FBS: Florida -- 92.86
FCS: San Diego -- 89.90
D2: North Alabama -- 90.50
D3: Husson (Maine) -- 84.81
NAIA: Morningside (Iowa) -- 87.47
Rushing Defense
FBS: Alabama -- 63.9 yards per game allowed
FCS: Colgate -- 69.4
D2: Northwest Missouri State -- 67.7
D3: Husson (Maine) -- 47.6
NAIA: Marian (Ind.) -- 64.7
Yards Per Carry Allowed
FBS: Alabama -- 2.01
FCS: Central Arkansas -- 2.29
D2: Northwest Missouri State -- 1.99
D3: Husson (Maine) -- 1.59
NAIA: Marian (Ind.) -- 2.09
Sacks Per Game
FBS: Florida State -- 3.92
FCS: Grambling -- 3.42
D2: McKendree (Ill.) -- 4.82
D3: North Central (Ill.) -- 4.25
NAIA: Marian (Ind.) -- 4.00
Third Down Defense
FBS: Michigan -- 21.0 percent
FCS: Jacksonville State -- 23.1
D2: Lane (Tenn.) -- 23.7
D3: Husson (Maine) -- 19.9
NAIA: Marian (Ind.) -- 23.2
Red Zone Touchdown Percentage Allowed
FBS: LSU -- 24.24 percent
FCS: Grambling -- 34.4
D2: Azusa Pacific (Calif.) -- 35.3
D3: Bowdoin (Maine) -- 32.8
NAIA: Bowdoin (Maine) -- 32.8
Turnover Margin
FBS: Washington/Western Michigan -- 1.29
FCS: South Carolina State/Southern -- 1.64
D2: Indiana (Pa.) -- 2.08
D3: Plymouth State (N.H.) -- 2.50
NAIA: Marian (Ind.) -- 1.80
