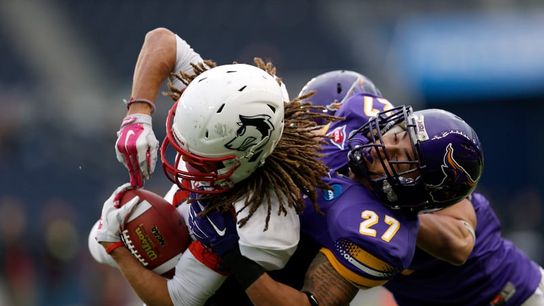
We're all a bunch of liars.
When a coach or media member refers to a team's pass rush or third-down offense as "the best in college football," that person is probably incorrect. More often than not, that all-encompassing term "the best in college football" references only the FBS, the game's highest-profile subdivision but still less than 20 percent of its total population, rather than the entire sport at large.
So we decided to examine all five divisions of college football, 746 programs in all between the NCAA and NAIA, to find the best in 26 different statistical categories to determine once and for all who had the best first downs defense in 2014.
OFFENSE
Scoring Offense
FBS: Baylor - 48.2 points per game
FCS: Eastern Washington - 44.1 points per game
D2: Texas A&M-Commerce - 54.1 points per game
D3: Mount Union (Ohio) - 58.5 points per game
NAIA: Morningside (Iowa) - 55.5 points per game
Touchdowns Per Game
FBS: Baylor - 6.31
FCS: Alcorn State - 6.08
D2: Texas A&M-Commerce - 7
D3: Mount Union (Ohio) - 7.53
NAIA: Morningside (Iowa) - 7.92
Total Offense
FBS: Baylor - 581.5 yards per game
FCS: Yale - 571.5 yards per game
D2: Texas A&M-Commerce -535.4 yards per game
D3: Mount Union (Ohio) - 589.9 yards per game
NAIA: Morningside (Iowa) - 662.2 yards per game
Yards Per Play
FBS: Marshall - 7.59
FCS: Alcorn State/Illinois State - 6.91
D2: Texas A&M-Commerce - 7.47
D3: Mount Union (Ohio) - 7.85
NAIA: Morningside (Iowa) - 8.18
Passing Offense
FBS: Washington State - 477.7 yards per game
FCS: Idaho State - 348.1 yards per game
D2: New Mexico Highlands - 388.5 yards per game
D3: Whitworth (Wash.)/East Texas Baptist - 368.1 yards per game
NAIA: Southern Oregon - 383.0 yards per game
Passing Efficiency
FBS: Oregon - 180.78
FCS: Villanova - 175.25
D2: Harding (Ark.) - 188.13
D3: Guilford College (N.C.) - 176.39
NAIA: Morningside (Iowa) - 193.6
Yards Per Attempt
FBS: Oregon - 9.9
FCS: Eastern Washington - 8.73
D2: Texas A&M-Commerce - 10.31
D3: Delaware Valley College (Pa.) - 10.11
NAIA: Morningside (Iowa) - 11.48
Rushing Offense
FBS: Georgia Southern - 379.9 yards per game
FCS: Cal Poly - 351.8 yards per game
D2: Lenoir-Rhyne (N.C.) - 416.3 yards per game
D3: Maine Maritime - 393.9 yards per game
NAIA: Morningside (Iowa) - 354.8 yards per game
Yards Per Carry
FBS: Georgia Southern - 7.11
FCS: Alcorn State - 6.42
D2: Lenoir-Rhyne (N.C.) - 6.57
D3: Heidelberg (Ohio) - 6.67
NAIA: Morningside (Iowa) - 6.54
First Downs Per Game
FBS: Baylor - 30.1
FCS: Idaho State - 27.9
D2: Colorado Mines - 29.1
D3: Mount Union (Ohio) - 28.6
NAIA: Morningside (Iowa) - 29.8
Third Down Conversions
FBS: Georgia Tech - 57.9%
FCS: Yale - 51.7%
D2: Ferris State (Mich.) - 56.2%
D3: Guilford (N.C.) - 58.1%
NAIA: Morningside (Iowa) - 53.2%
DEFENSE
Scoring Defense
FBS: Ole Miss - 16.0 points per game
FCS: Harvard - 12.3 points per game
D2: Colorado State-Pueblo - 12.8 points per game
D3: Amherst College (Mass.) - 8.9 points per game
NAIA: Northwestern (Iowa) - 15.2 points per game
Touchdowns Per Game Allowed
FBS: Ole Miss - 1.85
FCS: Harvard - 1.5
D2: Colorado State-Pueblo - 1.53
D3: Amherst (Mass.) - 1.13
NAIA: Northwestern (Iowa)/Tabor (Kan.) - 2
Total Defense
FBS: Clemson - 260.8 yards per game
FCS: Bethune-Cookman - 237.5 yards per game
D2: Northwest Missouri State - 213.1 yards per game
D3: Wesleyan (Conn.) - 220.8 yards per game
NAIA: Northwestern (Iowa) - 247.5 yards per game
Yards Per Play Allowed
FBS: Clemson - 4.03
FCS: Bethune-Cookman - 3.97
D2: Northwest Missouri State - 3.58
D3: Wesleyan (Conn.)/Linfield (Ore.) - 3.59
NAIA: Northwestern (Iowa) - 3.58
Passing Defense
FBS: San Jose State - 117.8 yards per game
FCS: Samford - 139.1 yards per game
D2: Newberry (S.C.) - 120.1 yards per game
D3: St. Lawrence (N.Y.) - 114.5 yards per game
NAIA: Edward Waters (Fla.) - 111.5 yards per game
Pass Efficiency Defense
FBS: Clemson - 98.3
FCS: Southeastern Louisiana - 94.3
D2: Oklahoma Panhandle State - 84.3
D3: St. Lawrence (N.Y.) - 76.8
NAIA: Northwestern (Iowa) - 71.5
Yards Per Attempt Allowed
FBS: Clemson - 5.3
FCS: Bethune-Cookman/Southeastern Louisiana - 5.45
D2: Indianapolis - 4.61
D3: Wesleyan (Conn.) - 4.59
NAIA: Northwestern (Iowa) - 4.60
Rushing Defense
FBS: Michigan State - 88.5 yards per game
FCS: Bethune-Cookman - 79.9 yards per game
D2: Shepherd (W. Va.) - 44.3 yards per game
D3: Wabash (Ind.) - 66.3 yards per game
NAIA: Robert Morris (Ill.) - 75.8 yards per game
Yards Per Carry Allowed
FBS: TCU - 2.78
FCS: Sacred Heart - 2.43
D2: Shepherd (W. Va.) - 1.63
D3: Wabash (Ind.) - 1.91
NAIA: Robert Morris (Ill.) - 2.22
First Downs Per Game Allowed
FBS: Clemson - 14.2
FCS: Bethune-Cookman - 14.0
D2: Shepherd (W. Va.) - 11.5
D3: Trinity (Conn.) - 12.6
NAIA: Siena Heights (Mich.) - 13.3
Third Down Conversions Allowed
FBS: Clemson - 27.4%
FCS: Bethune-Cookman - 25.0%
D2: Shepherd (W. Va.) - 23.2%
D3: Adrian (Mich.) - 21.1%
NAIA: Northwestern (Iowa) - 24.9%
Sacks Per Game
FBS: Utah - 4.23
FCS: Grambling - 3.75
D2: Humboldt State (Calif.) - 4.5
D3: Wabash (Ind.) - 4.58
NAIA: Georgetown (Ky.) - 4.0
Tackles For Loss Per Game
FBS: Clemson - 10.08
FCS: Grambling - 10.1
D2: Texas A&M-Commerce - 10.8
D3: Bethany (W. Va.) - 10.9
NAIA: N/A
OTHER
Turnover Margin
FBS: Oregon - 1.53
FCS: Albany - 1.25
D2: Bloomsburg (Pa.) - 2.31
D3: Redlands (Ca.) - 2.44
NAIA: N/A
Penalties Per Game
FBS: Navy - 2.54
FCS: Gardner-Webb - 3.58
D2: Michigan Tech - 2.55
D3: Buena Vista (Iowa) - 2.90
NAIA: Benedictine (Kan.) - 4.45
