For those in the media and advertising industries, Nielsen is the Bible. Nielsen's media research and television ratings are gospel across the media industry, and their figures direct billions of dollars in advertising cash flow as large corporations attempt to reach the audiences they want to influence. That's why networks can afford to shell out billion-dollar contracts.
Last week, Nielsen released its annual year-end media report for sports, and it's packed full of information that everyone in college football should know. Business is booming in college football, and this report details why.
Let's start with the most obvious, television viewers for each major American sport's largest event from the past year.
Super Bowl XLVIII: Seattle Seahawks vs. Denver Broncos - 112.2 million
NBA Finals Game 7: Miami Heat vs. San Antonio Spurs - 26.3 million
BCS National Championship: Florida State vs. Auburn - 25.6 million
NCAA Basketball Championship: Louisville vs. Michigan - 23.4 million
World Series Game 6: Boston Red Sox vs. St. Louis Cardinals - 18 million
Daytona 500 - 16.7 million
Kentucky Derby - 16.2 million
The Masters - 14.7 million
Stanley Cup Finals Game 6: Chicago Blackhawks vs. Boston Bruins - 8.6 million
What does this tell us about American culture? First, Americans love them some NFL. The Super Bowl drew more viewers than the biggest events of the NBA, college football, college basketball, Major League Baseball and NASCAR put together. The NFL also crushes the Oscars, the Emmys, the Grammys, American Idol and whatever else the entertainment industry can muster. The NFL is an entire continent full of 800-pound gorillas.
Aside from that, Americans like winner-take-all sporting events. LeBron, Tim Duncan and the drama of a Game 7 edged out the BCS championship for the second spot, and Louisville's thrilling win over Michigan came in fourth. Other than the win-or-go-home aspect of the NFL playoffs, those were the only sporting events to crack 20 million viewers.
Outside of the BCS National Championship, bowl games were the most-watched games in 2013.
2. Rose Bowl: Michigan State vs. Stanford - 18.6 million
3. Sugar Bowl: Oklahoma vs. Alabama - 16.3 million
4. Orange Bowl: Clemson vs. Ohio State - 11.4 million
5. Fiesta Bowl: Central Florida vs. Baylor - 11.3 million
Earlier this week, the NCAA reported that the SEC was once again college football's highest-drawing conference. And, once again, the SEC was also college football's top draw on television.
1. SEC - 9.7 million average viewers
2. Big Ten - 7 million
3. ACC - 5.3 million
4. Big 12 - 4.2 million
5. Notre Dame - 4 million
6. Pac-12 - 3.9 million
Nielsen also provided a nice look at which schools had the largest local fanbases, a term they defined as a percentage of the population that attended, watched or listened to a game over the past 12 months.
1. Ohio State (Columbus) - 66 percent
2. Alabama (Birmingham) - 65 percent
3. Arkansas (Little Rock) - 58 percent
4. Tennessee (Knoxville) - 56 percent
5. Oklahoma (Oklahoma City) - 55 percent
Each of those five schools has something in common. They're large state institutions without much local professional competition (three of the five have no local NFL competition at all) in mid-sized markets. It's much easier for Oklahoma to dominate Oklahoma City than it is for Stanford to own San Francisco.
Next, let's look chunk of fresh meat advertisers lock their teeth on, Twitter. According to Nielsen, here are the total tweets pecked out from each of America's largest sporting events.
Super Bowl XLVIII: Seattle Seahawks vs. Denver Broncos - 25.3 million
BCS National Championship: Florida State vs. Auburn - 4.4 million
NBA Finals: Miami Heat vs. San Antonio Spurs - 3.81 million*
NCAA Basketball Championship: Louisville vs. Michigan - 3.3 million
Kentucky Derby - 3 million
The Masters - 800,000
World Series: Boston Red Sox vs. St. Louis Cardinals - 716,000
Daytona 500 - 500,000
Stanley Cup Finals: Chicago Blackhawks vs. Boston Bruins - 466,000*
* - averaged on a per game basis
Again, the NFL is completely untouchable but, other than that, nothing drew more social engagement than the BCS championship. The BCS National Championship inspired more tweets over its three-and-a-half hours than all six World Series games combined. College football is a community event, in person and on television, and that's valuable to advertisers.
Speaking of advertisers, here were the five biggest advertisers for college football.
1. AT&T
2. Taco Bell
3. Aflac
4. Verizon Wireless
5. Home Depot
AT&T, Taco Bell and Verizon spread their spending out evenly across the sporting landscape, but Aflac and Home Depot invested their largest advertising dollars on college football. Home Depot basically funds College GameDay's entire budget. In the days of massive television contracts that foot the bills for new facilities and eight-figure contracts, these companies indirectly pay many coaches' salaries.
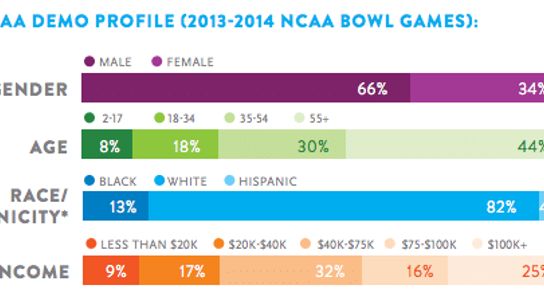
Lastly, here is a demographic breakdown of college football viewers for the 2013-14 bowl season. When advertisers look at which sports to buy, this is their scouting report.
Let's take a look at that last part, because that's what every advertiser is after: money. And college sports fans have a lot of it. In fact, college sports has more fans earning $100,000 or more a year than any sport other than golf and hockey. Add in the fact that college football's audience dwarfs golf, hockey and college basketball, and you can see why Saturday football is the most valuable advertising real estate on the market outside of the NFL.
NHL - 33 percent of fans earning $100,000 or more a year
Golf - 27 percent
College basketball - 27 percent
College football - 25 percent
NFL - 25 percent
Major League Baseball - 21 percent
Soccer - 20 percent
NBA - 18 percent
Motor sports - 14 percent
